
Many business owners in India buy website speed optimization services after seeing a red score in PageSpeed Insights. A few days later they get a green score, a screenshot and an invoice. Then the site feels the same to customers, and Search Console still shows the same problems. The score changed. The experience did not.
This guide explains what real speed work involves, how it should be measured, what a good audit looks like, and the questions to ask before you pay anyone, including us.
What website speed optimization services should actually deliver
The goal of website speed optimization is that real visitors, on their own phones and networks, get a page that appears quickly, responds quickly when they tap, and does not jump around while it loads. Google measures those three things with the Core Web Vitals. A provider’s job is to find which of them fail on your site, why they fail, and to fix the causes in a way that lasts after the next plugin update or marketing campaign.
How speed is measured: field data and lab data
There are two kinds of speed data, and confusing them is the root of most bad speed projects.
- Field data (CrUX)
- Real measurements from Chrome users who agreed to share data, collected by the Chrome UX Report over a 28-day sliding window and reported at the 75th percentile. PageSpeed Insights shows it at the top of the report, and Search Console’s Core Web Vitals report is built on it.
- Lab data (Lighthouse)
- A simulated load of the page on one device with fixed network settings. It gives the 0-100 performance score (90 or above is good) and useful diagnostics, but the score can change between runs even when nothing on the page changed.
Field data is what your customers feel. Lab data is a tool for finding causes and testing fixes before they reach real users. CrUX has limits: it only covers Chrome users who opted in, it excludes Chrome on iOS, and many smaller sites do not have enough traffic to appear in it at all. If your site has no field data, a provider should add real user monitoring (RUM) to collect your own, rather than relying only on lab scores.
| Metric | What it measures | Good (75th percentile) |
|---|---|---|
| Largest Contentful Paint (LCP) | How quickly the main content appears | 2.5 seconds or less |
| Interaction to Next Paint (INP) | How quickly the page responds to taps, clicks and key presses | 200 milliseconds or less |
| Cumulative Layout Shift (CLS) | How much the layout jumps while loading | 0.1 or less |
INP replaced First Input Delay (FID) as a Core Web Vital on 12 March 2024. If a proposal still talks about FID, it is out of date. Our guides on Core Web Vitals and Interaction to Next Paint explain each metric in more depth. Time to First Byte (TTFB) is also worth tracking: web.dev suggests most sites aim for 0.8 seconds or less, though TTFB is not itself a Core Web Vital.
The actual work, area by area
Images
Images are often the largest files on a page and very often the LCP element. The work: serve modern formats such as WebP or AVIF, resize images to the size they are shown at instead of shipping a 4,000-pixel photo to a phone, add width and height so the browser reserves space, and lazy-load images further down the page with loading="lazy". Never lazy-load the main image at the top of the page: web.dev warns that this delays LCP. For that image, fetchpriority="high" helps the browser start it early.
Fonts
Web fonts can block text from showing, or cause a visible jump when the font swaps in. Fixes include using fewer font families and weights, preloading the one or two critical fonts, choosing a font-display setting on purpose, and matching the fallback font’s size closely so the swap does not shift the layout.
JavaScript and third-party scripts
This is where most INP problems live. Long tasks on the main thread, heavy click handlers and large pages built in the browser all slow down responses. Third-party scripts add to it: chat widgets, ad tags, analytics, A/B testing tools and heat maps each bring their own code and network requests. web.dev advises auditing them regularly, removing duplicates (you rarely need two tag managers or two analytics tools) and setting a budget. Every script in your tag manager should have an owner and a reason. A chat widget can often load after the first interaction instead of on page load.
Caching and CDN
Browser caching lets repeat visitors reuse files they already downloaded. Page caching lets the server send a ready-made page instead of building it on each visit. A content delivery network (CDN) serves files from locations closer to the visitor; web.dev calls it the best way to bring content closer to users and cut LCP time. Image CDNs can also resize and convert images automatically.
Server response and hosting
If the server takes too long to send the first byte, web.dev notes that a 2.5 second LCP can become hard or impossible. Causes include slow database queries, too many plugins running on each request, chains of redirects and an underpowered or far-away server. Sometimes the right fix is a hosting change. Our guide to web hosting in India covers what to look for.
Layout shifts
CLS comes from images and videos without dimensions, ads and embeds without reserved space, banners and pop-ups injected near the top, and font swaps. The fixes are mostly about reserving space before content arrives.
Problem, fix and the metric it moves
| Problem found | Typical fix | Metric it moves |
|---|---|---|
| Large hero image in JPEG or PNG | Convert to WebP or AVIF, resize, add fetchpriority="high" | LCP |
| Hero image lazy-loaded | Load it normally; lazy-load only images below the fold | LCP |
| Slow server response | Page caching, fewer redirects, faster queries, better hosting | TTFB, LCP |
| Visitors far from the server | Serve static files and images through a CDN | LCP |
| Chat widget and many tags on page load | Remove unused tags, delay non-essential scripts | INP, LCP |
| Heavy click handlers and long tasks | Break up long tasks, defer non-urgent work | INP |
| Images and embeds without dimensions | Add width and height or reserve space with CSS | CLS |
| Banner injected at the top after load | Reserve space or place it lower | CLS |
| Font swap shifts text | Preload key fonts, match fallback size | CLS, LCP |
What a good audit deliverable looks like
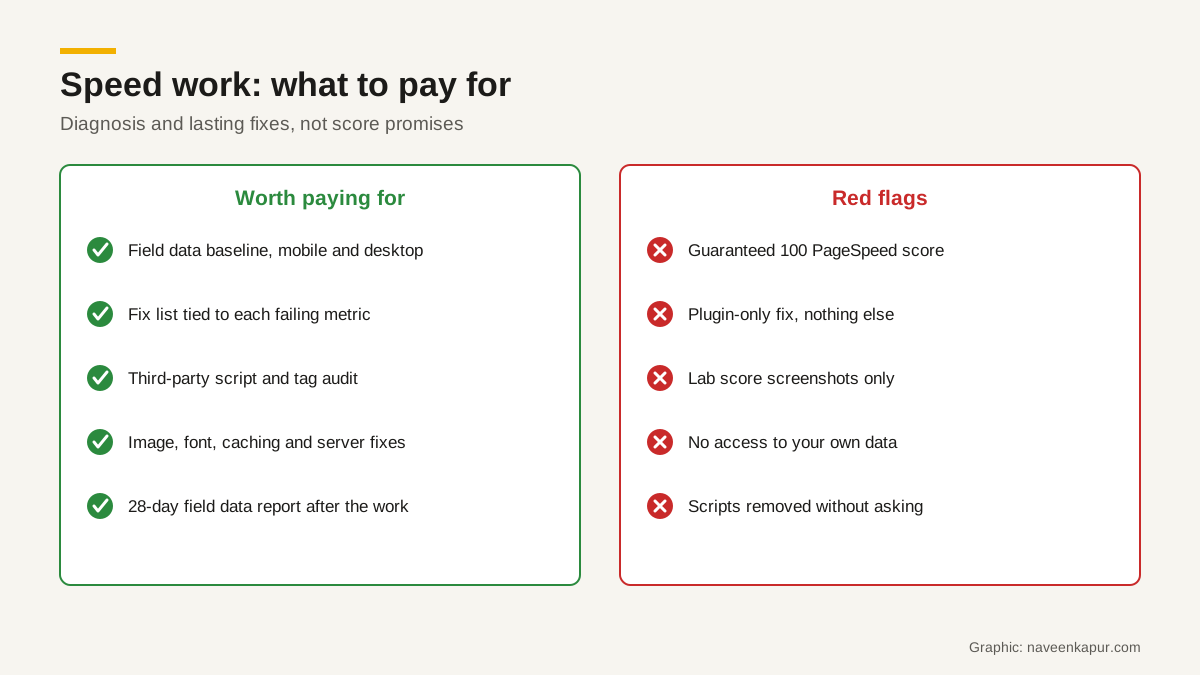
- A baseline from field data: LCP, INP and CLS at the 75th percentile, mobile and desktop separately, from PageSpeed Insights or Search Console, with the date taken.
- Page groups, not one URL: the home page, a category or service page, a product or article page and the main landing pages for ads. Search Console groups similar URLs for the same reason.
- A cause for each failure: for example, “LCP fails on product pages because the main image is lazy-loaded and 1.2 MB”, with lab traces as evidence.
- A prioritised fix list: each fix linked to the metric it should move, with effort and risk noted, and who does it (developer, hosting, marketing team for tags).
- A list of third-party scripts: what each does, who owns it, and whether it can be removed, delayed or kept.
- A testing plan: how fixes will be checked on staging before they go live, so forms, payments and tracking keep working.

Before and after: report with field data
Lab scores can show a fix worked the same day. Field data cannot, because CrUX uses a 28-day window: the old, slower visits only drop out after about four weeks. Search Console’s Core Web Vitals report works the same way. When you click to validate a fix, it starts a 28-day monitoring session.
So an honest core web vitals optimization report has two parts: lab results right after the work, and a field data comparison about a month later, for the same page groups and devices. Ask for both in the contract. If traffic, campaigns or the site design changed in that month, the report should say so.
What not to buy
- A guaranteed 100 PageSpeed score. The lab score varies between runs, it is one simulated device, and it is not what your customers experience. A 100 can be reached on a test page while real pages stay slow.
- Plugin-only fixes. A caching or optimisation plugin can help, but turning on every option can break menus, forms or tracking, and it does not fix heavy themes, slow hosting or too many tags.
- Screenshots without data access. You should be able to check results yourself in PageSpeed Insights and Search Console.
- Silent removal of scripts. Deleting your analytics or ad tags makes the score better and your marketing blind. Any removal must be agreed first.
- Rank promises. Google recommends good Core Web Vitals for success in Search, but no one can promise a ranking from speed work alone.
Questions to ask a provider before you pay
- 1Will you start from field data, and what will you do if my site has no CrUX data?
- 2Which pages and page groups will you test, on mobile and desktop?
- 3Can I see a sample audit from a past project, with client details removed?
- 4Which fixes are in scope: theme or code changes, images, fonts, scripts, caching, CDN, hosting?
- 5How will you handle third-party scripts and tags, and who approves removing or delaying them?
- 6How will you test that forms, payments and analytics still work after the changes?
- 7Will I get a field data report about 28 days after the work, and is that included in the price?
- 8What happens if a theme, plugin or app update undoes the fixes?
Getting the work done
Speed work is ordinary engineering: measure with field data, find causes, fix them in priority order, and check the result a month later. If you want this done as part of a site build or rebuild, the web design and development service page explains how that work is scoped.